Javascript is disabled or not supported. Please enable JavaScript to display the website correctly.
If there are any problems, please contact us!

Your Microsoft-certified ERP partner for SMEs for more than 20 years!

Data with Little Informative Value Are

Your Challenge without Power BI

Do you have an overview of the performance of all branches? Can you evaluate the reasons for complaints from your customers? Can you visualize key sales figures that are critical to success, broken down by region and time period? No? Then let us change that. Your data is probably currently scattered across various sources and you lack an overview. This makes it difficult and extremely time-consuming to make well-founded decisions.

Create interactive Dashboards easily

Through the Solution: Power BI

Microsoft Power BI is an interactive business intelligence tool for data visualization. It allows you to track important business developments at any time by creating live dashboards and reports from various data sources – even on mobile devices. This helps you eliminate the inefficiencies of isolated data silos and enables you to act more quickly.

The usage is simple: If you are looking for specific data, you can ask a question in natural language in Microsoft Power BI and receive suggestions for visualizations from the BI system. Additionally, you can leverage your existing data, forecasts, and trends. What more could you want?

Note: Let Microsoft Copilot take care of routine tasks! This is integrated into the Power Platform and supports you in creating reports, writing DAX queries and generating summaries. All you have to do is describe what you need and Copilot takes over.
From Raw Data to Insights - Why You Need Power BI:

These Are Your Benefits

Ein Laptop, der Daten zeigt

Visualization

Create comprehensive tables, interactive diagrams and easily integrate map services. You can also share these with your team.

Ein Icon, das Vernetzung symbolisieren soll

Many Data Sources

You can link data from a wide variety of tables (e.g., stock value and item price). You are not limited to one application.

Eine ToDo-Liste mit Haken als Bullet-Points

Basis for Action

You can keep an eye on developments and recognize immediately when action is required. This makes it easier for you to make decisions and convince third parties.

Power BI Examples:

Examples from Practice for Power BI for Dynamics 365 Business Central

Power BI can be used for a wide variety of scenarios. We have put together some general Power BI visualizations for you, as well as practical examples of integration with Dynamics 365 Business Central. Can you find your situation in an example?

    • Finance

      • Financial reports: Companies can present financial data such as revenue, costs, and profit in interactive dashboards to monitor the financial health of the business.
      • Budget monitoring: Power BI can be used to track budget variances and analyze expenses in real-time.
    • Operational Management

      • Supply Chain Management: Companies can analyze the performance of their supply chains, identify bottlenecks, and monitor the efficiency of suppliers.
      • Production Analysis: In manufacturing, production data can be analyzed to minimize downtime and increase productivity.
    • E-Commerce

      • Analyzing Customer Behavior: Online retailers can use Power BI to track sales, conversion rates, average order value, and other key performance indicators. Dashboards can help understand customer behavior and make optimizations.
      • Inventory Management: Monitoring inventory in real-time to avoid overstocking or stockouts.
    • IT services

      • Dashboard for Ticket System: Comparison of planned hours with actual hours.
      • Sales Dashboard: Sales staff can extract data for sales opportunities.
    • Dashboard on company development

      Requirement of the customer: There should be a general exchange of data from Business Central with Power BI in order to create meaningful reports (e. g. development of market share, sales, sentiment, competition by region and time period).

      Solution: To enable smooth data exchange between Business Central and Power BI, you can either access the web services in Business Central or develop an API that can be used to build the reports.

    • Cross-client or company-wide evaluations

      Requirement of the customer: There should be a general exchange of data from Business Central with Power BI in order to create meaningful reports (e. g. development of market share, sales, sentiment, competition by region and time period).

      Solution: To enable smooth data exchange between Business Central and Power BI, you can either access the web services in Business Central or develop an API that can be used to build the reports.

    • Overview of personnel figures

      Requirement of the customer: There should be a report that shows how many new hires there are compared to the previous year, by gender, by age or by percentage development.

      Solution: A development was made in Business Central that makes it possible to record personnel data and track the development of this data using Power BI.

    • Smart sales dashboard

      Requirement of the customer: There should be a map of Germany with information on target and actual sales figures.

      Solution: The sales and vendor data is retrieved from Business Central and a relation is created to visualize the data in the dashboard.

    • Evaluation of reasons for complaints

      Requirement of the customer: In the future, materials that are prone to errors should be filtered out.

      Solution: A sales complaint including the reasons for the complaint are available in Business Central as standard and can be called up. The greens can then be listed and sorted by frequency in the Power BI report.

    • Creation of a vacation overview for employees

      Requirement of the customer: The vacation days of all employees should be listed in a chart to provide a better overview of which employees are on vacation and when.

      Solution: Creation of a Power BI report that loads the vacation management from Business Central in a report and displays the approved and requested vacation days in a matrix. The report is always updated on a daily basis and includes the option to filter by year and month.

      Vacation overview in Power BI
      Vacation overview in Power BI
    • Clear presentation of consumption by month

      Requirement of the customer: Support is needed to set up the planning parameters in Business Central more precisely.

      Solution: Creation of a report that determines the consumption quantity of items per month based on historical values from Business Central and displays key figures such as procurement time, stock level, range, order point and safety stock.

      Übersicht Verbräuche nach Monat in Power BI
      Overview of consumption by month in Power BI
    • Key figures for outgoing goods

      Requirement of the customer: Outgoing goods are to be evaluated to increase customer satisfaction.

      Solution: Creation of a report that shows the number of deliveries (daily performance), partial deliveries, missing items and the average delivery time.

      Report on outgoing goods in Power BI
      Report on outgoing goods in Power BI
Decision made easy:

anaptis takes You to the next Level!

Why Power BI for your business? With anaptis by your side, you have a reliable Power BI partner and trustworthy Power BI consulting. We provide you with an overview of what makes us unique.

Zwei Männer am Schreibtisch

Why anaptis? Discover the advantages that will make your heart beat faster:

  • Standard-oriented software

    We prefer a standard-based software approach and first assess if a requirement can be solved with the standard. This is how we ensure that you remain independent and Update-capable!

  • Honesty & fairness

    From day one, expect honest and fair statements. We also stick to our commitments.
  • Fair usage rights to the code

    You receive fair usage rights to the individual content created by us, including editing and access by third parties.
  • Personal support

    You’ll be supported by a dedicated project team. We ensure that everyone feels included and understood.
  • Agile project methodology

    Our unique project methodology is structured but flexible – with maximum transparency, minimum costs, interactive workshops instead of specifications and comprehensible communication without technical jargon.
  • Modernity & innovation

    With state-of-the-art technologies and a specialized innovation team, we help you get more out of your data.
The Perfect Match?

Is Power BI suitable for my Company?

mann-leistet-support

Power BI is designed for medium-sized businesses across various industries. You can easily embed and share reports in other Microsoft services such as Teams, PowerPoint, Excel, and Power Platform. Enhance your efficiency and make data-driven decisions in your organization with Power BI.

Do you still have doubts? Feel free to reach out to us, and we will explore together how to visualize your data even better in Power BI!

Our Customers are Convinced by Power BI:

Take a Look at Our References to See for Yourself

  • Still Have Questions about Power BI?

    We Provide You with Answers in the FAQ

      • How does Power BI work? What are Power BI dashboards?

        With Microsoft Power BI, you can visualize your data in a variety of display options (e.g., dashboard of company development, target and actual sales figures). A Power BI dashboard is an interactive page that consolidates and displays important data and metrics from various sources in the form of visualizations. This allows you to consolidate data from different sources and reduce manual activities. The consolidation of data from a wide range of different sources resolves the inefficiency of isolated databases in particular.

        In addition, you can recognize the need for action more quickly and take more targeted action by sharing it with your team, other departments or management.

      • What is Power BI Desktop? Is Power BI Desktop free of charge?

        Yes, Microsoft Power BI Desktop is a free application that you can install on your local computer. This allows you to connect to your data via various data sources on your desktop, combine them in a data model and visualize them (summarized: modeling). You can update your visualizations at the touch of a button (not automatically). Please note that sharing with colleagues is not possible with Power BI Desktop.

      • Is Power BI free of charge?

        The costs of Microsoft Power BI depends on the chosen features and subscription duration. You have the option to choose between Power BI Desktop (free), Power BI Pro (starting from € 15.72 per user per month), and Power BI Premium (starting from € 27.00 per user per month).

        You can find a price and feature overview on our Prices page.

      • Is Power BI included in Office 365?

        Power BI is not included in Office 365 as a standard. Only Power BI Pro is included in Microsoft 365 E5. You can find an overview of licensing options on our Prices page.

      • Is Power BI better than Excel?

        Power BI offers more visualizations, larger data models, update options, and enables better collaboration.

      • Which companies are suitable for Power BI?

        Power BI is suitable for a wide range of companies and industries, as it offers a flexible and user-friendly business intelligence solution. In particular, medium-sized enterprises from all sectors can optimize their data analysis and reporting with Power BI. For example, manufacturing companies can analyze production data, identify bottlenecks, and optimize their supply chain using Power BI.

      • Do I need technical knowledge to use Power BI?

        Power BI was designed to enable users to analyze data and create reports without requiring extensive technical knowledge. However, there are some basic skills that can be helpful: A fundamental understanding of data structures and formats (visualizations) is useful. If you are already familiar with Excel, many concepts in Power BI will seem familiar to you.

      • Which systems/data sources can I connect to Power BI?

        Power BI offers a variety of options for connecting to different data sources and systems. For example, Power BI supports a wide range of data sources such as Excel, CSV, databases (like SQL Server, Oracle), cloud services (like SharePoint, Azure, Google Analytics), as well as web APIs and custom scripts (R, Python). Additionally, many third-party sources can be integrated through the Power BI Marketplace.

      • How secure is my data in Power BI (Cloud)?

        The security of your data in Power BI (Cloud) is ensured through multiple measures and standards. Power BI encrypts data both at rest and in transit. Additionally, Power BI supports various authentication methods, including Azure Active Directory (AAD) for user sign-in. This enables strong identity management and multi-factor authentication. Furthermore, Power BI offers extensive options for user and group management. You can grant specific access rights to reports and dashboards to ensure that only authorized users can access sensitive data.

      • Self-Service BI (SSBI) - just marketing or reality?

        Self-Service BI is easily achievable with pre-built standard tables. These provide a rough overview of typical metrics (e.g., revenue, costs, customers). If the company also has IT personnel, additional requirements beyond these standard tables can usually be managed in-house. This is a matter of effort and IT competence. In our opinion, the difficulty lies in data extraction from the system. Often, the requirements on the company side are very complex. It is important to write the right system queries and know where in the system data can be obtained. However, visualization or visual customization is simple and user-friendly. So, if the company has the necessary data, visualization is feasible. The self-service BI approach is therefore not an empty marketing promise and is limited possible.

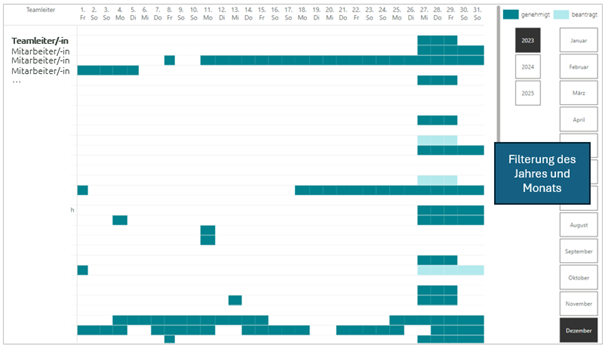
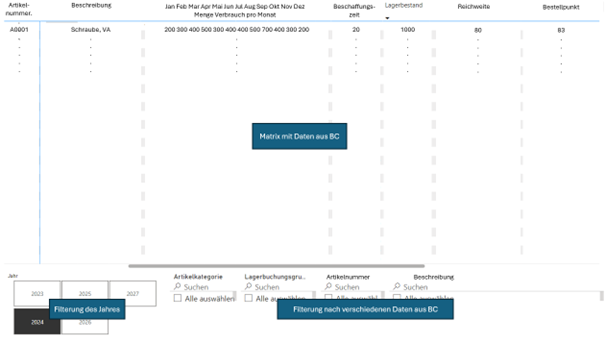
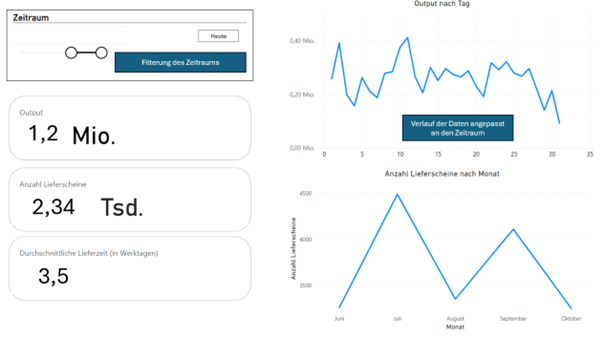
        However, if a company wants to present specific case studies beyond these standard tables, they often consult Microsoft partner companies. Examples include: production analyses, proportion of faulty products, analyses by clients (e.g., branches), procurement analysis, sales by region, overview of personnel figures, and sales dashboards.

        We advise you to weigh effort and benefit and to seek out a competent and experienced Microsoft partner company for your first complex Power BI project. This will help you achieve your goal of desired data visualization and also learn how to use Microsoft Power BI yourself.

      • Can I use Power BI with my local Dynamics NAV (formerly Navision) environment?

        Yes, you can. To be able to use Power BI with the local Microsoft Dynamics NAV (formerly Navision) environment, the OData service must first be activated for the web service. The OData feed is used to provide the data basis from the SQL server. Which data is available can be checked under “Web services” in the client. The OData feed URL that Power BI requires to query the data can also be found there. Only the “Query” object type is initially relevant for Power BI. Many queries are already available as standard, such as a list of all sales orders by sales person. However, you can also create your own queries in the development environment with just a few clicks. These newly created queries must then be created in the web services before you can get started.

      • What is the best way to get started with Power BI for Dynamics 365 Business Central?

        We are happy to offer support for a quick and efficient setup. We will show you how to generate added value from your data using Power BI. Are you not yet familiar with the Dynamics 365 Business Central user interface and would like to dive deeper? We will introduce you to the tool and answer the following questions, among others:

        • What is Power BI?
        • What can Microsoft Power BI Desktop and Microsoft Power BI Online do?
        • Where/how can I use the applications effectively?
        • How do I integrate Power BI into Dynamics 365 Business Central or Dynamics NAV?

        After that, we will take a look at your use case together and build an initial analysis (workshop).

        We reserve the right to qualify your request by finding out during a brief phone call whether we can assist you. After qualification, we will first have a conversation with you about your requirements so that we can address your needs and expectations.

      • Which data from Business Central can be transferred to Power BI?

        In Microsoft Dynamics 365 Business Central, a variety of data can be transferred to Power BI. In addition to purchasing data, such as purchase orders or supplier information, you can also utilize your inventory data, for example, stock levels and item movements for your analyses. Power BI allows you to connect directly with Business Central and retrieve data in real-time. You can also export data from Business Central (e.g., as CSV or Excel) and import it into Power BI.

      • Are the permissions from Business Central transferred to Power BI?

        In Microsoft Dynamics 365 Business Central, permissions and roles are used to control access to data. When you import data from Business Central into Power BI, permissions are typically not transferred directly. However, there are ways to ensure that users in Power BI only see the data they are authorized to access in Business Central. This can be achieved by implementing Row-Level Security (RLS) in Power BI. With RLS, you can define rules that control access to specific data rows based on user identities.

      • Can Power BI reports be embedded directly in Business Central?

        Yes, Power BI reports can be embedded directly in Microsoft Dynamics 365 Business Central. Business Central offers the ability to integrate Power BI dashboards and reports into the user interface, allowing users to access important data and analytics without leaving the application.

      • Do you offer ready-made templates for Power BI for Dynamics 365 Business Central?

        Using classic dashboards and targeted analyses, you can uncover causes, identify correlations, understand changes, and identify trends. Through our cooperation with our partner navida, we offer ready-made Power BI templates. Fully integrated into Dynamics 365 Business Central/Dynamics NAV. Together, we offer you three packages or tools for Dynamics 365 Business Central: Finance, Sales, Purchasing.

        If you are interested, please feel free to contact us or send a message.

    Part of the Microsoft Power Platform:

    Discover more Content from the Power Platform

    What Are You Waiting For?

    Let's Craft Your Success Story together

    Get to know us! In a free initial consultation, we’ll determine together if we, as a partner company, and the ERP system for medium-sized businesses, are the right solution for you and your company.

    We are looking forward to your inquiry!

    geschaeftsfuehrung-anaptis

    Request Free Consultation

      How did you hear about us?
      How may we contact you?*

      Fields marked with * are mandatory and must be filled out!

      Spam protection question*