Make the right decisions in no time: In Dynamics 365 Business Central, you can customize and flexible reportings based on real-time data.
Well-founded decisions thanks to real-time evaluations
Standardized database & simple analyses
Power BI & Copilot for smart insights
Navision Projects:
Reports in Dynamics 365 Business Central: Always well-informed
Reports can be created individually and flexibly in Dynamics 365 Business Central (formerly Dynamics NAV/Navision) based on real-time data. They allow you to visualize data (e.g., overview of price updates) or to print them (e.g., invoices). You can choose from hundreds of existing standard reports or create your own reports and export them to Excel at the push of a button, if desired. Reports can even be scheduled (e.g., report XY should be sent every Friday at 12:00 PM).
Powerful Functions of the Dynamics 365 Reports:
Your Functions for Reportings in Business Central
The reporting functions are available to you in all central areas: Finance, Sales, Purchasing, Warehouse, Projects and Production. This gives you cross-divisional insights and makes it easy to recognize correlations.
Dimensions are attributes or values that categorize items (customer items, vendor items, material items, etc.) so that you can track and analyze them. They are attached to master or transaction data in the workflow to retrieve this additional information at the item level later on. The more dimensions you set up and use, the more detailed the reports you can rely on for business decisions.
These are not fixed programmed fields but rather an entity that can be freely configured by users or administrators. Additionally, filling in the dimensions at the document level can be automated by pre-populating them at the master data level (e.g., assigning a specific area code per postal code for each customer).
Examples:
“Department” dimension in sales orders → Track which department has sold how many items
“Postal Code” dimension in sales orders → Track which area the customers are from
“Commissionable Goods” dimension in sales orders → Track how much commissionable goods a salesperson has sold
“Bonus Eligible Goods” dimension in sales orders → Track how much bonus eligible goods a salesperson has sold
You have the option of designing reports yourself using Word layouts and Excel layouts (new since April 2022). For example, you can customize the invoice design or build email templates.
Through the integration of Power BI, you can create user-friendly charts based on your data. These visualizations can be seamlessly integrated into your dashboard. Within the application, you can:
You can make reports available on a time-controlled and automated basis. For example, you can have any report automatically sent to the management’s inbox once a week at 8 am.
Dynamics 365 Business Central makes it possible to systematically record environmental data such as CO₂ emissions, energy consumption or sustainability certificates and prepare them in reports. These sustainability reports are not just stand-alone evaluations, but can also be combined with traditional financial and company key figures. For example, emissions data can be integrated directly into financial reports, providing a holistic view of the company’s performance – both financially and ecologically. This link is particularly important in light of new legal requirements (e.g. CSRD) and the growing expectations of investors and customers for transparency and sustainability.
New: The Sustainability Manager in Dynamics 365 Business Central
By integrating sustainability data into central reporting, companies can visualize their progress towards environmental goals, meet legal requirements and make more informed strategic decisions. The new dashboards and scorecards in the Sustainability Manager Role Center help to record relevant environmental key figures and the development of emissions at a glance and compare them with other company data.
Microsoft Reporting Tools are Strong in Comparison:
Your Benefits through the Reports in Dynamics 365 Business Central
Aggregated Data
Reports can be based on integrated real-time data from all departments.
Bais for Decision-Making
Make decisions based on sound data and convince third parties with your key figures.
Flexible Design
Create your own reports according to the individual needs of your company and evaluate them flexibly.
From Theory to Practice:
Tutorial: Reports withDynamics 365 Business Central
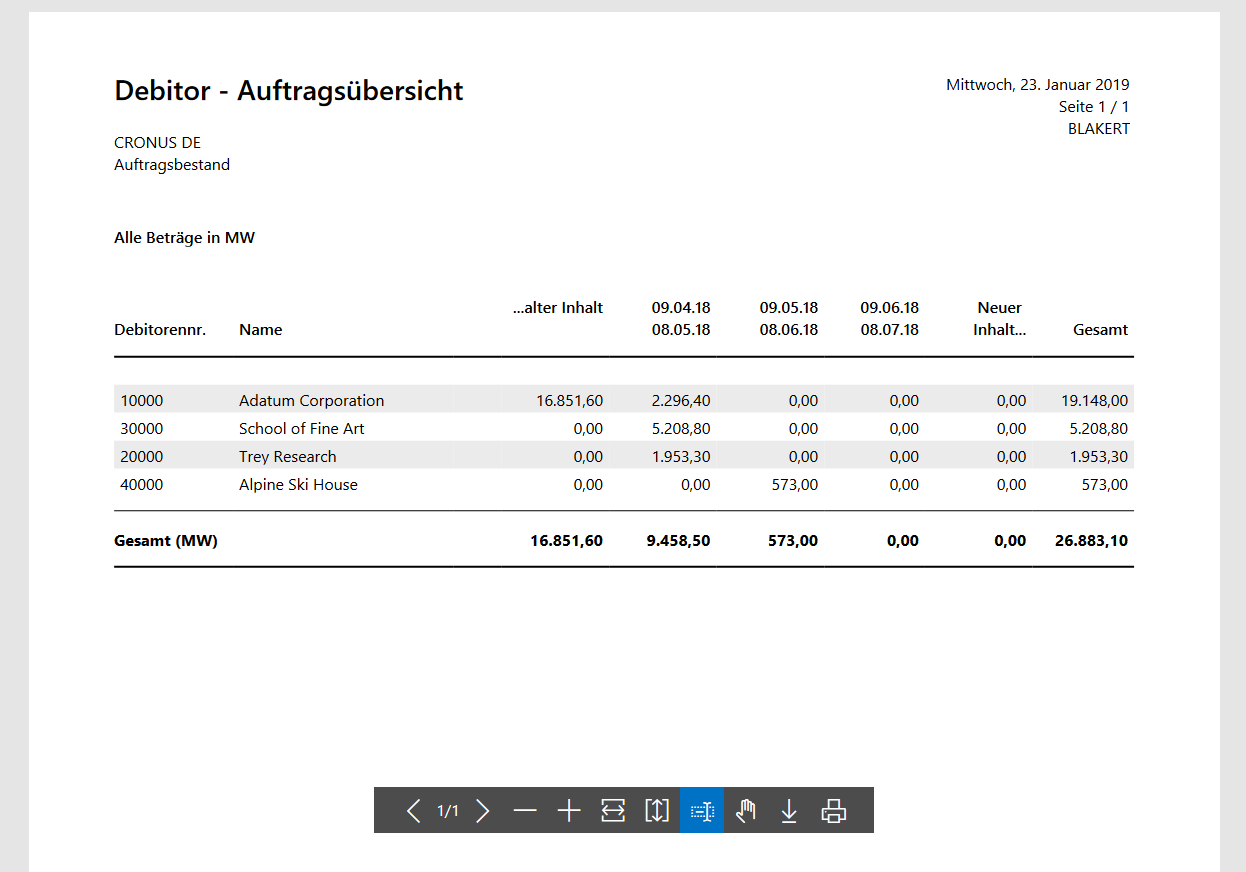
Depending on your role, the system suggests different reports that you can create. As an example, let’s consider the role of Sales Order Processing. If you work in sales, you can create various reports regarding debtors, such as an order overview, a top 10 list, or a debtor/item statistics. To select these options, you can click on Actions > Reports directly in your personal dashboard at the top right corner.
Personal Dashboard
Now select a report you want to create, for example, the Customer – Order Overview report. A page will open where you can determine which information should be included in the report. This page is called the Report Request Page and looks as follows:
Report Request Page
Depending on how a report is set up, it’s possible to use saved settings. These are predefined sets of options and filters that you can apply to reports. This allows you to create reports quickly and reliably with the right data. The settings can be created and managed by an admin for all users.
Furthermore, there’s the option to use recently used options and filters. This allows you to create a report with the same options and filters you used last time when you created the report.
You can also set options and filters to be displayed in the report. To define a filter, select Customer as the criterion you want to set (e.g., customer number) and under is, enter the value (e.g., “No. 1000”). This way, only the customer with number 1000 would be displayed in the report.
Next to the Preview button, at the end of the Report Request Page, there’s also the Send to… function. You select this to save the report as a PDF document, Microsoft Word document, or Microsoft Excel document.
When you click on Send to…, in addition to the option to save, you also have the option of scheduling. If you select this, you can specify the date and time when the report should be executed.
Plan Report
You can also specify whether you want to save, print or just process the processed report.
Decision Made Easy:
Why anaptis? Your Benefits
We have been a Microsoft-certified partner for medium-sized businesses for over 20 years. We assist you with the implementation of Dynamics 365 Business Central, upgrading existing systems, or providing support for your current software. Our clients operate in a wide range of industries, as we do not offer pre-packaged solutions but instead provide tailored, near-standard solutions that are precisely adapted to your individual processes. No frills. Only what you truly need.
Why anaptis? Discover the advantages that will make your heart beat faster:
We prefer a standard-based software approach and first assess if a requirement can be solved with the standard. This is how we ensure that you remain independent and Update-capable!
Our unique project methodology is structured but flexible – with maximum transparency, minimum costs, interactive workshops instead of specifications and comprehensible communication without technical jargon.
Get to know us! In a free initial consultation, we’ll determine together if we, as a partner company, and the ERP system for medium-sized businesses, are the right solution for you and your company.
 loading="eager" alt="dynamics-business-central">